
Coverage
We know every suburb
We know every suburb
by its yield curve.
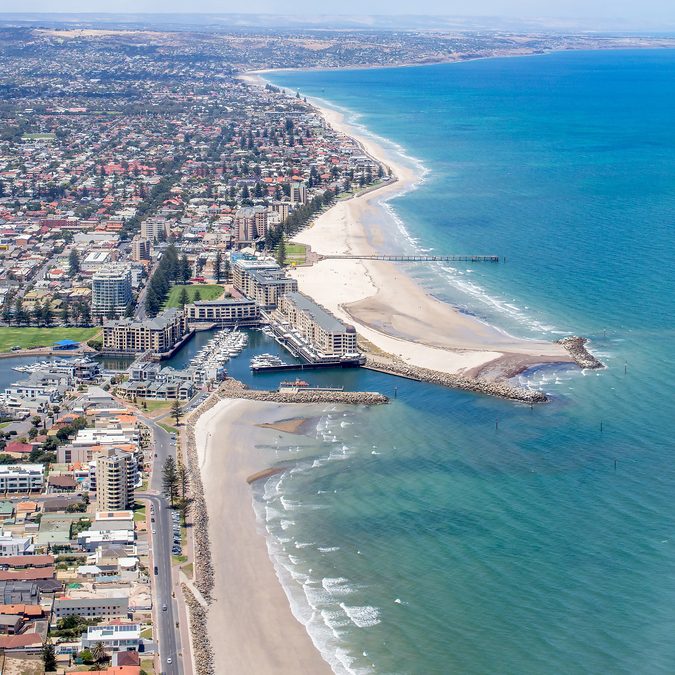
From beachside surge suburbs to Hills retreat properties, our Airbnb and short-term rental management across Adelaide is mapped by demand, event uplift, and seasonal yield.
Beachside
City Fringe
Adelaide Hills
Event Corridors


Demand Zones
Where we operate
Beachside
Glenelg · West Beach · Henley Beach · Semaphore
Peak: Dec–Feb · WomAdelaide · LIV Golf
2BR avg $3,900/mo
City Fringe
Adelaide CBD · Norwood · Unley · Burnside · Prospect
Peak: Fringe · Gather Round · Year-round business
2BR avg $3,600/mo
Adelaide Hills
Stirling · Crafers · Hahndorf · Aldgate · Mt Barker
Peak: Fringe · Tasting Australia · Jun–Aug retreats
2BR avg $3,800/mo
Service Area
Our service area
Yield Intelligence
Revenue by suburb cluster
| Suburb Cluster | 2BR Monthly Range | Peak Event Uplift | Demand | Peak Season |
|---|---|---|---|---|
|
Glenelg · West Beach · Henley
Glenelg, West Beach, Henley Beach, Semaphore
|
$3,600–$4,400 |
LIV Golf
+50 to 100% above baseline
|
|
Dec–Feb · Apr |
|
Adelaide CBD
Adelaide CBD, North Adelaide
|
$3,400–$4,000 |
Gather Round
+50 to 100% above baseline
|
|
Feb–Apr · year-round |
|
Norwood · Unley · Burnside
Norwood, Unley, Burnside, Kensington, Prospect
|
$3,200–$3,900 |
Adelaide Fringe
+up to 30% above baseline
|
|
Feb–Apr |
|
Stirling · Hahndorf · Hills
Stirling, Crafers, Hahndorf, Aldgate, Mt Barker
|
$3,400–$4,200 |
Tasting Australia
+up to 30% above baseline
|
|
Feb–May · Jun–Aug |
|
Brighton · Marino · Hallett Cove
Brighton, Marino, Hallett Cove, O'Halloran Hill
|
$3,400–$4,000 |
LIV Golf
+50 to 100% above baseline
|
|
Dec–Feb · Apr |
|
Prospect · Nailsworth · Broadview
Prospect, Nailsworth, Broadview, Blair Athol
|
$2,900–$3,600 |
Gather Round
+50 to 100% above baseline
|
|
Feb–Apr |
Revenue ranges based on Aurea portfolio data. Event uplift figures represent percentage increase above baseline nightly rate during peak event windows.
Your suburb.
Your yield curve.
Use the calculator on our homepage for a personalised revenue estimate, or apply for a full property assessment.
Apply for asset management